Predicting World Happiness Using Machine Learning
Authors: Kaitlin Khong, Jade Thai, Sarah Liang
Background
The World Happiness Report 2023 data set is telephone and face-to-face interview survey data, retrieved from Gallup World Poll (GWP), depicting a reflection of quality of life and subjective life evaluations by country. This information can help evaluate resilience of countries, especially through global times of crisis, like the COVID-19 pandemic, war conflicts, and more. The data was obtained through telephone and face to-face interviews conducted to individuals 15 years or older in developed and developing countries respectively. The individuals were chosen by random sample in each country, either by random-digit-dial or 1 random household selection by geological area. Since our data was obtained through random sampling from the general civilian adult population of each country, we can then make inferences about the civilian adult population of each country.
The data set has 2,199 observations, with each row observation denoting measurements of happiness and wellbeing by country for a specific year from 2008 to present. The data set has eleven variables, nine of which are different economical and emotional measures of life quality.
Preprocessing
We now must address the missing values in each predictor variable. Since the proportion of missing values in each variable appears very small, all under 6% of missing, we can conclude the probability of being missing is small and consistent across all the variables. This suggests we have a case of missing at random (MAR). This may be due to a certain smaller, underdeveloped country that poses difficulty of retrieving samples from, which can cause a consistent pattern of missing by a certain country.
We have numerical predictor variables in different measurement units, like proportion (0 to 1 scale), 0 to 10 scale, and log scale. The data is also spread unevenly across their respective measurement scales and/or possible ranges. So, we normalize the data to make valid comparisons later on after modeling.
Exploratory Data Analysis (EDA)
- Is national happiness level more influenced by subjectively perceived emotional factors, like positive and negative emotions and having a social support network, or is it more influenced by economical factors, like GDP and having the financial comfort and/or ability to donate to charity.
In recent years there have been many globally impacting and stress-inducing crises, like the COVID-19 pandemic, Ukranian-Russian conflict, Gaza-Israeli conflict, the climate crisis, and more. Has there been a significant decrease in happiness level that can likely be attributed to these recent global issues?
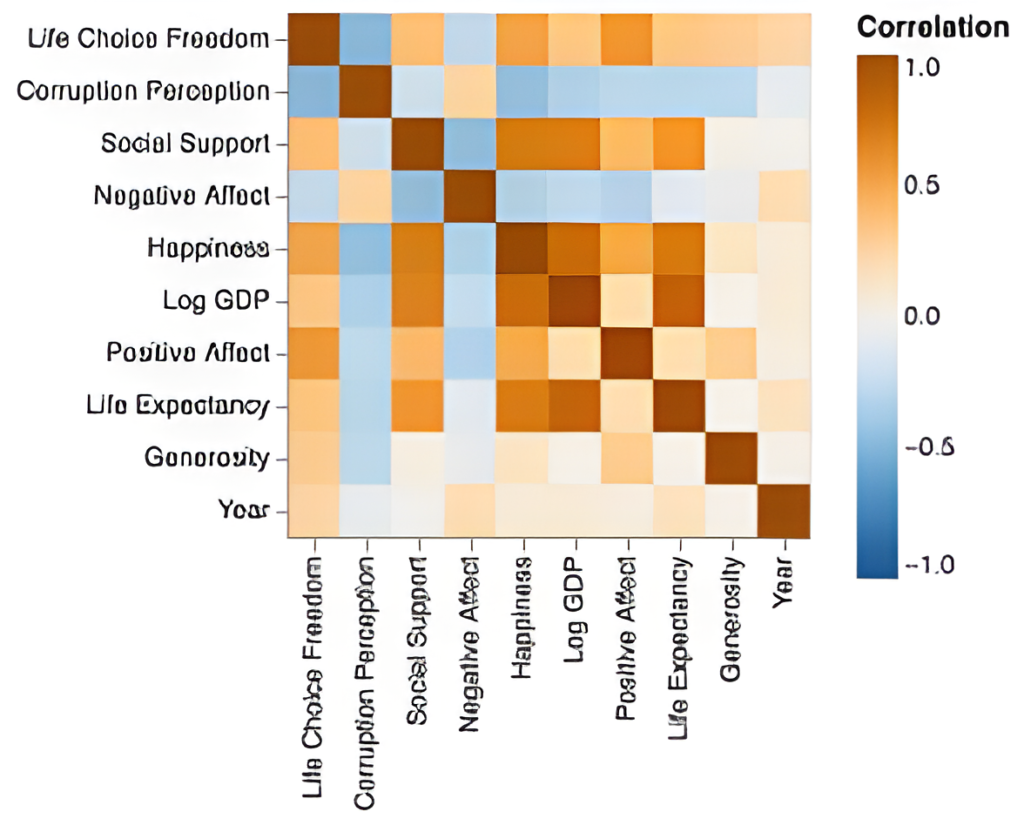
As we can see, there are some predictors that are correlated with one another which can cause issues of collinearity. The most notable case of collinearity is between Log GDP and Life Expectancy with a correlation of 0.831. Therefore, we must drop one of these predictors. Since Log GDP has a stronger correlation with our response variable, we will drop Life Expectancy from the regression model.
Now let’s take a closer look at the relationships between some of our predictors with our response variable.
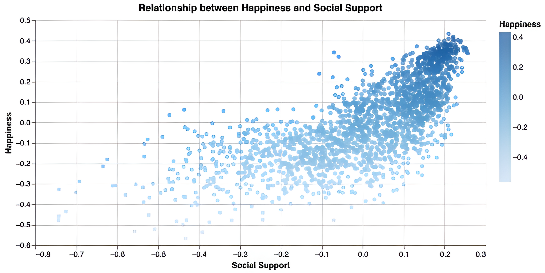


Taking a look at the relationship between happiness and social support, we can see a clear positive correlation with density increasing as both rise. This makes sense because social support provides individuals with a network of care, practical help, and a sense of security, which can positively affect national happiness.
The correlation verifies that supportive relationships are key to psychological health and well-being, reinforcing that humans thrive on positive social interactions.
PCA
Since we centered and scaled our data, we are able to do principal component analysis. We use PCA to compare variation in happiness levels among all eight predictors dependent on time. Let’s compute the eight principal components.
We will construct a dual-axis plot showing the proportion of variance explained (left y axis) and cumulative variance explained (right y axis) as a function of principal component number (x axis), with points indicating the variance ratios and lines connecting the points.
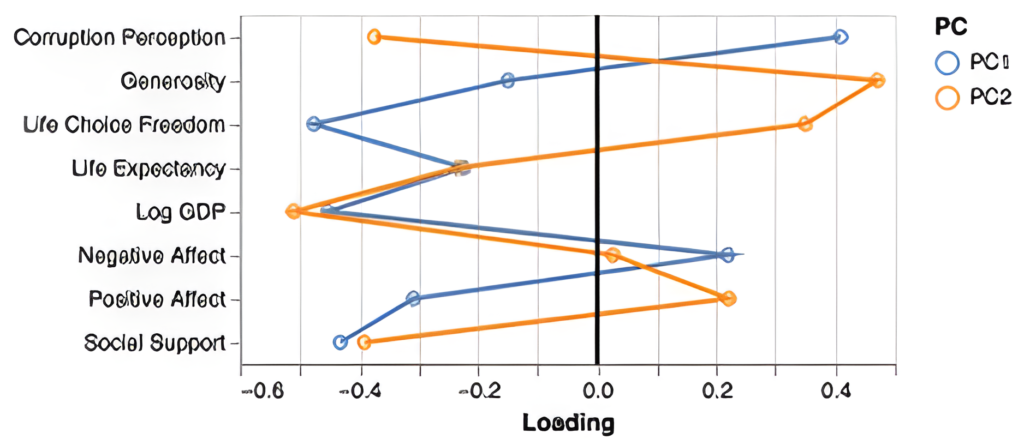
For PC1, it seems that Corruption Perception (positive), Life Choice Freedom (negative), Log GDP (negative), and Social Support (negative) have the largest loadings. Thus, a higher level of Corruption Perception and lower level of Life Choice Freedom , Log GDP , and Social Support indicates a higher value for PC1.
For PC2, it seems that Corruption Perception (negative), Generosity (positive), Life Choice Freedom (positive), Log GDP (negative), and Social Support (negative) have the largest loadings. Thus, a higher level of Generosity and Life Choice Freedom and a lower level of Corruption Perception , Log GDP , and Social Support indicates a higher value for PC2.
We can interpret general national happiness as a composition of different levels of our predictors. It seems that PC1 would be associated with lower levels of national happiness and PC2 would be associated with higher levels of national happiness. Thus we can interpret our principal compenents as the following:
PC1 is an index for a certain composition of predictors that indicate lower levels of happiness
PC2 is an index for a certain composition of predictors that indicate higher levels of happiness
For further analysis of these principal components dependent on different time periods, let’s project the data onto the principal components and plot according to different time periods.
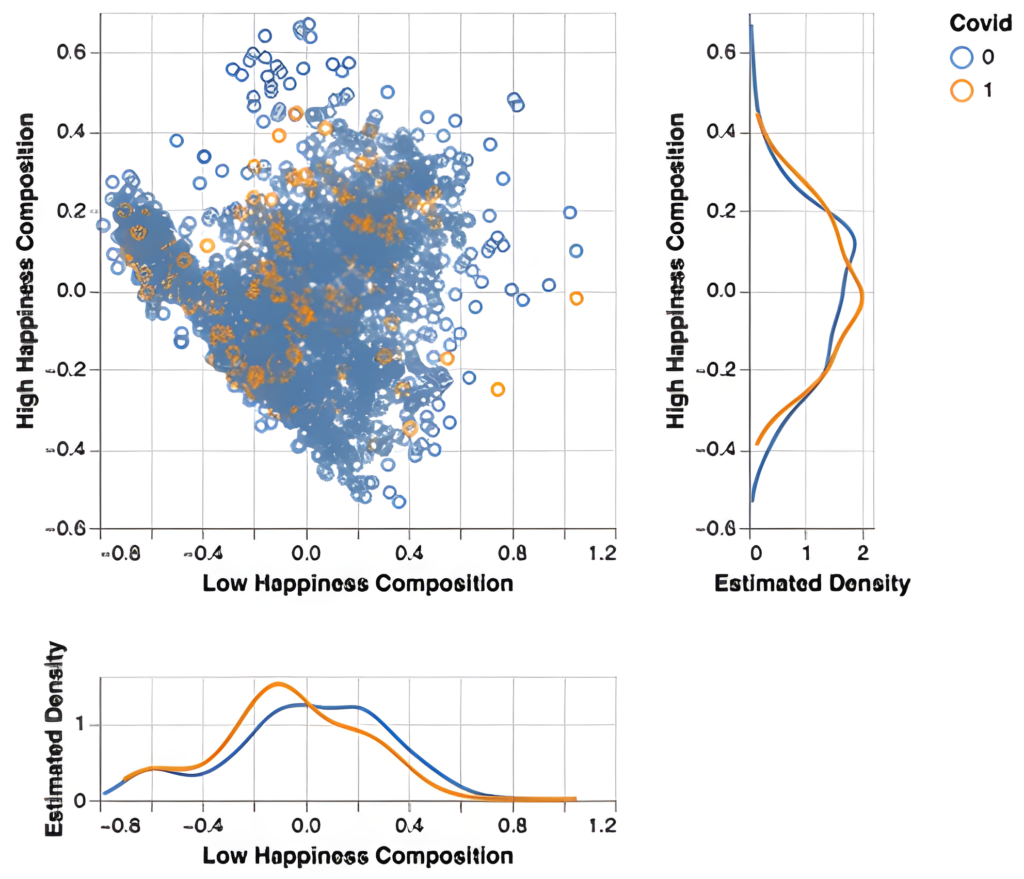
There does not seem to be any difference in global happiness levels when considering the possiblity of the influence of COVID-19. This may be due to overall lack of data, since COVID-19 lasted about two years.
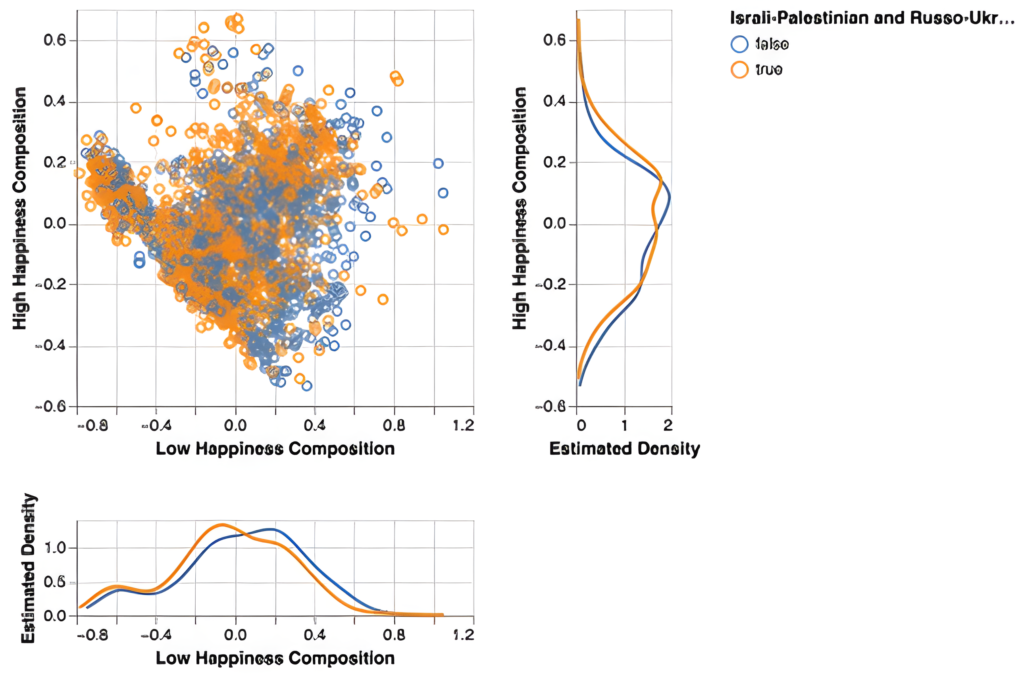
Again, there does not seem to be any significant difference in global happiness when considering the possible influence of war conflicts, such as the ongoing Israeli-Palestinian or Russo-Ukranian war conflicts. In terms of influencing happiness on a global scale, it is difficult to determine if happiness levels have changed significantly with the consideration of time.
Regression Analysis
To answer the question of which factors most heavily influence national happiness, we will perform a multiple linear regression analysis. We will model national happiness as a function of log GDP per capita, social support, life choice freedom, generosity, corruption perception, positive emotions, and negative emotions, to observe the significance of each variable in predicting the response.
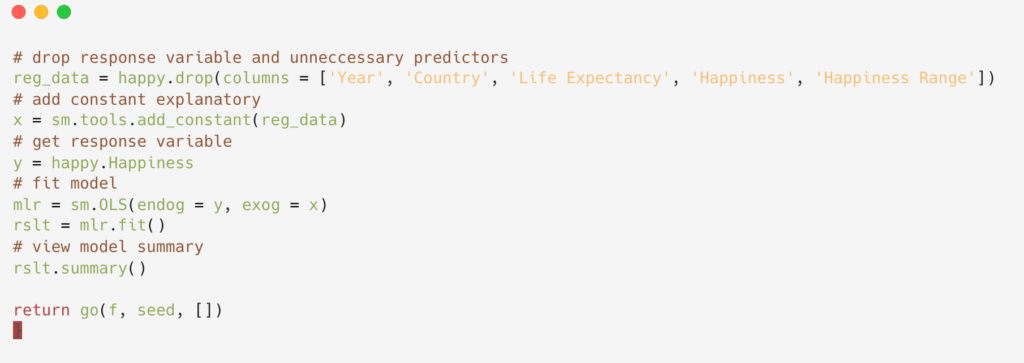
For every 1 unit increase in log(GDP), national happiness increases by 0.5583. A 1 unit rise in social support, life choice freedom, generosity, and positive effect leads to increases of 0.2357, 0.0642, 0.0636, and 0.2783 in national happiness, respectively. A 1 unit increase in corruption perception decreases national happiness by 0.1154.
Summary
Based on our analysis of the 2023 World Happiness Report, we have found that the national happiness level of any given country is influenced by a combination of both subjectively perceived emotional factors and economical factors. Our regression analysis revealed that nation wide positivity, the national average of individuals who have a social support network, and the nation’s gross domestic product have the strongest influence on happiness level. This corroborates our exploratory data analysis, in which we observed the correlations between our predictors and response. As expected, predictors with stronger correlations to happiness had larger coefficients in our multiple linear regression model.
We also performed principal component analysis on the data to extract the key information from our data. The first two principal components for our analysis jointly captured 65% of the total variation in the data. We found that the first principal component was an index for indicating lower levels of happiness. This principal component was a composition of predictors in which strong national feelings of government corruption, a low gross domestic product, and little life choice freedom or social support contribute largely to this index. This analysis also corroborates our findings in the regression analysis by providing further evidence of the effects of certain emotional and economic factors on happiness.
As part of our exploratory analysis, we also observed how certain global crises affected happiness levels. Specifically, we analyzed national happiness during the COVID-19 pandemic along with the Israeli-Palestinian and Russo-Ukranian war conflicts. We used density estimation to compare the estimated probability distribution of happiness levels during times of crisis and no crisis. After conducting this analysis, we found that there was not a significant drop in global happiness during these crises. This can be due to a lack of data, since the time period for COVID-19 was only two years, or there may have been less data collection during these times of crisis.
Overall, we have found that national happiness is overall influenced by a combination of emotional and economical factors, namely national wealth, positivity, and social support systems.
